All three are single components of steviol glycosides. The molecular skeleton is the same; the difference is the number of glucose units: Reb A carries 4, Reb D 5 and Reb M 6. The more glucose units, the better the solubility and the closer the sweetness curve sits to sucrose - but the lower the content in the leaf, and the harder the component is to obtain by extraction.
The same family has a more basic component, stevioside (STv), which carries only 3 glucose units. It is the most abundant component in traditional varieties and the starting point of this glucose ladder.
| Component | Formula / MW | Glucose units (C13 | C19) | Profile and typical use |
|---|
| Stevioside (STv) | C38H60O18 / 805 | 2 (1→2 linear) | 1 | Less sweet than Reb A; lowest cost, the backbone of the ST series |
| Reb A | C44H70O23 / 967 | 3 (1→2, 1→3 branched) | 1 | About 350x against 2% sucrose and 180x against 8%; the mainstream commercial component behind RA97 and RA60 naming |
| Reb D | C50H80O28 / 1129 | 3 (branched) | 2 (1→2 linear) | Same sweetness band as Reb A, curve closer to sucrose; low in leaf, so mostly enzymatically converted |
| Reb M | C56H90O33 / 1291 | 3 (branched) | 3 (branched) | 180-350x band, the curve closest to sucrose; highest price, mainly premium beverages and dairy |
Table 1 - Formulas per GB 1886.355-2022 chapter 2; molecular weights per JECFA Table A (FAO JECFA Monographs 26, 2021), rounded. CAS numbers in the same order: 57817-89-7, 58543-16-1, 63279-13-0, 1220616-44-3. Each added glucose unit adds 162 to the molecular weight, which is why 805 → 967 → 1129 → 1291 rises in equal steps. In the table, 1→2 and 1→3 describe the bonds between glucose units: the two 1→2-linked glucoses at C13 of stevioside are the only linear structure in the group, everything else carries a 1→3 branch.
Distribution in the leaf drives price
The distribution in Stevia rebaudiana leaves is very uneven. Reb A is the main component and can exceed 10% of dry leaf in high-RA varieties. Reb D is low, and Reb M is very low - too low to be obtained economically from leaf.
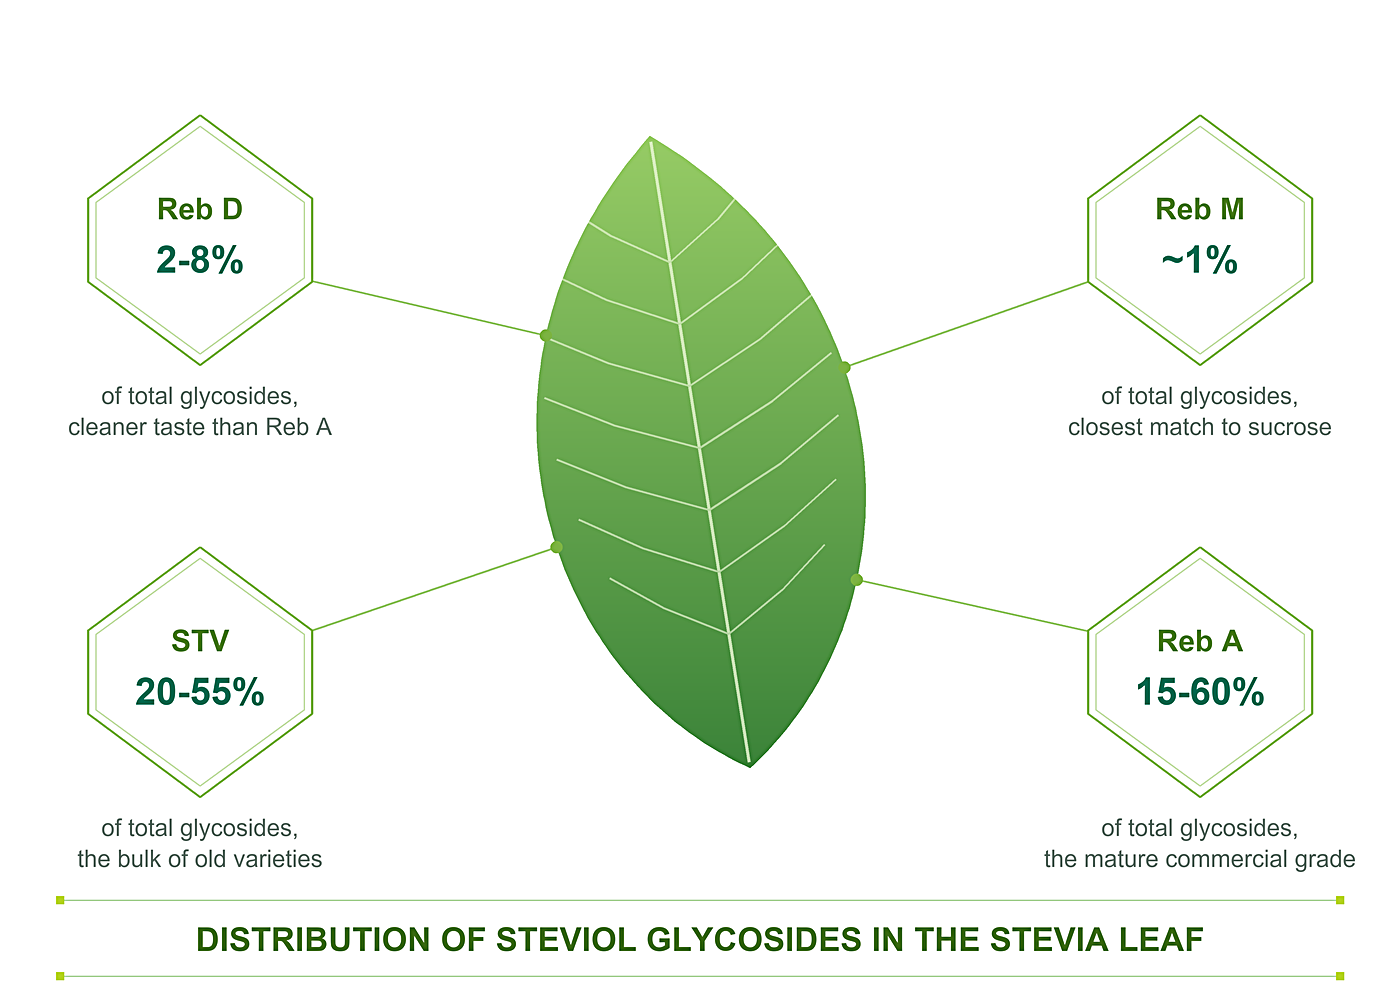
Figure 1 - Share of total steviol glycosides in the dried leaf. Ranges vary with variety and growing region; they are the reason Reb M is converted rather than extracted.
That is why commercial Reb M is mostly not extracted but produced by enzymatic conversion (INS 960c) or microbial fermentation (INS 960b). It is also the underlying reason Reb M costs more than Reb A.
On sweetness, Reb A and Reb M both fall in the 180-350 times band and move with the concentration of the sucrose reference. What really separates them is the shape of the sweetness curve rather than peak intensity.
Primary sources: JECFA specifications (INS 960a-960d); GB 1886.355-2022
Related products: Reb-A Series · Optimvia Reb-M / Reb-D